Motion · Dữ liệu
Biểu đồ sống động
Ba kiểu làm biểu đồ "sống dậy" — oscilloscope-stream dòng sóng thời gian thực có đỉnh nhọn bất chợt, unit-dot-swarm-regroup bầy chấm di cư tái nhóm thành số, axis-rescale-shock giá trị mới vọt khỏi khung buộc trục vẽ lại.
Nguồn: video-shotcraft (Vincent Wei) ↗ · Apache-2.0 · Composition Remotion (React/TSX) — có video preview, không có player trong trình duyệt
Biến thể
Cửa sổ lấy mẫu dịch 8px/khung + đỉnh nhọn theo bao hình cosine + phanh dừng thật sự.
Sản phẩm giám sát/thời gian thực: một hệ thống "đang sống".
Ba màn di cư spring so le (stiffness 150, so le 8f), màn cuối chấm xếp thành số.
Tường thuật quy mô/cơ cấu người dùng: "mỗi chấm là một con người".
Vọt ra ngoài khung 220px + vẽ lại liên động ba bước (đổi thang/dày lưới/nén đường cũ) + rung 8px.
Điểm nhấn đường tăng trưởng: hiện thực hóa nghĩa đen của "off the charts".
Khi nào dùng
Đoạn tường thuật dữ liệu; lần lượt kể "tính thời gian thực", "mỗi con số là một con người", "tăng trưởng vượt khung".
Ý đồ
Biểu đồ không phải minh họa, nó là kịch bản. Cả ba kiểu chung một tiền đề đã kiểm chứng: phải ở trong ngữ cảnh biểu đồ thật — nhãn trục thật/dữ liệu thật/chữ thật, thanh placeholder xám không đo được sức biểu đạt của tường thuật dữ liệu. A, oscilloscope-stream: điểm ghi ghim ở mép phải, nhấp nhô lên xuống, dữ liệu cũ trôi ra bên trái, giữa chừng một đỉnh nhọn bất chợt (biên độ 2.2×, số liệu nhảy vọt và chuyển màu nhấn) — "thời gian thực" không cần nói ra vì có chuyện đang xảy ra; B, unit-dot-swarm-regroup: 320 chấm (mỗi chấm ≈ 40 khách hàng) tản ra → tụ thành ba nhóm (nổi nhãn thật Free/Pro/Enterprise) → xếp hàng thành cột (nhãn trục thật) → tụ thành số lớn dạng ma trận chấm "12,847" — cùng một lô chấm, người xem có thể theo dõi một chấm đến tận nơi nó về; C, axis-rescale-shock: đường biểu diễn leo bình thường, giá trị mới húc thủng mép trên biểu đồ vọt ra ngoài thẻ 220px (đường nét đậm màu nhấn đâm vào vùng tiêu đề), dừng nửa nhịp, rồi trục y "soạt" một cái vẽ lại (thang cũ bay ra/thang mới trượt vào/lưới dày lên/đường cũ nén thành đường chân trời), giá trị mới rơi về vị trí và nhãn giá trị thật bật lên — dùng "trục không chứa nổi" để diễn tả tăng trưởng theo nghĩa đen "off the charts".
Thời lượng & năng lượng
- Thời lượng: Mỗi kiểu 4–6s.
- Năng lượng: Trung bình cao (dữ liệu chính là kịch bản).
Công thức cảnh quay (bản gốc tiếng Trung — timing, easing, bảng tham số, lỗi hay gặp)
意图
图表不是插图是剧情。三式共同前提(实测判例):必须真图表语境 ——真轴标/真数据/真文案,灰阶占位条测不出数据叙事的表达力。 A 示波流线:曲线写入点钉在右端上下起伏,旧数据左流出画,中途一次 突发尖峰(振幅 2.2×、读数跳大变强调色)——"实时"不用说出口,还有事件; B 点阵重组:320 个点(每点≈40 customers)散布→聚三簇(浮 Free/Pro/ Enterprise 真标签)→列队成柱(真轴标)→聚成点阵大数字 "12,847"—— 同一批点,观众能跟着某一颗看它归队; C 轴爆表:折线正常爬升,新值顶破图表上沿冲出卡片 220px(强调色粗线 插进标题区),停半拍,y 轴"哗"地重标(旧刻度飞出/新刻度滑入/网格 加密/旧线压扁成地平线),新值落回+弹真值标签——用"坐标轴装不下"演增长。
三式选型
| 式 | 核心动作 | 适用 | |----|----------|------| | A oscilloscope-stream | 采样窗平移 8px/f + 余弦包络尖峰 + 刹停真静止 | 监控/实时类产品:"活着"的系统 | | B unit-dot-swarm-regroup | 三幕 spring 错峰迁徙(stiffness 150、错峰 8f),终幕点阵拼数字 | 用户量/构成叙事:"每个点是一个人" | | C axis-rescale-shock | 冲出框 220px + 重标三联动(刻度换/网格密/旧线压扁)+ 震 8px | 增长曲线高光:"off the charts" 字面化 |
参数表
| 参数 | 典型值 | 调节手感 | |------|--------|----------| | 真语境 | 真标题/真轴标/真单位/真读数 | 入库前提:灰阶版三条全数被裁,换真语境后全过 | | 主角色 | 强调色(模板片为琥珀)标事件/主角(尖峰读数、Pro 簇、爆表段) | 全灰读不出"哪里是重点" | | A 流速 | 8px/f | 5.5 已可感,8 更明确;波形纯函数禁随机 | | B 点数/点径 | 320 / 9px | 点太少拼不出数字,太小看不见个体 | | C 冲出幅度 | 卡顶外 220px | 80px 版不够"爆";真的插进标题区才是事故感 | | 收尾 | 三式都要 ≥36f 真静止 | 数据图表尾漂读作还没播完 |
已知坑
- demo 在灰阶/占位素材上调校通过——参数是调校起点非实战定稿,
首次实战须以真实素材回验
- 三式是三种独立手法不是套餐——同片用两式以上时各 ≤1 次且错开段落
- A 的尖峰事件、C 的重标只能发生一次;重复即廉价
- B 终幕数字位图字形要预先手算(点数=位点数用满才整齐)
- 与 dataviz-landscape-open(抽象数据地景开场)分工:那是开场氛围,
这三式是段落内的具体数据论证
- 声音:A 尖峰一声警示 tick;B 每幕迁徙一声 whoosh;C 冲出框
一声 riser、重标一声"哗啦"
参考实现
demos/data/chart-live-moves/ (AxisRescaleShockV2.tsx / OscilloscopeStreamV2.tsx / UnitDotSwarmRegroupV2.tsx)
Mã nguồn tham chiếu (Remotion)
- demos/data/chart-live-moves/AxisRescaleShockV2.tsx — https://raw.githubusercontent.com/Vincentwei1021/video-shotcraft/main/demos/data/chart-live-moves/AxisRescaleShockV2.tsx
- demos/data/chart-live-moves/OscilloscopeStreamV2.tsx — https://raw.githubusercontent.com/Vincentwei1021/video-shotcraft/main/demos/data/chart-live-moves/OscilloscopeStreamV2.tsx
- demos/data/chart-live-moves/UnitDotSwarmRegroupV2.tsx — https://raw.githubusercontent.com/Vincentwei1021/video-shotcraft/main/demos/data/chart-live-moves/UnitDotSwarmRegroupV2.tsx
Component import fixture chung từ demos/_fixtures và helper từ assets/lib của repo; xem SKILL.md trong repo để biết quy trình render.
Mọi thứ trên trang này đều có bản máy đọc. Đưa agent link JSON, hoặc thêm MCP server gimgs rồi bảo nó tìm motion template.
- Tải JSON — trong đó có công thức cảnh quay (timing, easing, bảng tham số, lỗi hay gặp) và toàn bộ source TSX.
- Clone repo video-shotcraft; component import fixture chung từ demos/_fixtures và helper từ assets/lib.
- Đăng ký component thành <Composition> trong project Remotion rồi render bằng `npx remotion render`, hoặc dựng lại công thức bằng engine của bạn.
curl -s https://gimgs.net/motion/chart-live-moves.jsongit clone https://github.com/Vincentwei1021/video-shotcraft
# component: demos/data/chart-live-moves/AxisRescaleShockV2.tsx, demos/data/chart-live-moves/OscilloscopeStreamV2.tsx, demos/data/chart-live-moves/UnitDotSwarmRegroupV2.tsx
npx remotion render <CompositionId> out.mp4claude mcp add --transport http gimgs https://gimgs.net/mcp
# then: search_motion_templates / get_motion_template("chart-live-moves")Prompt
Use the video-shotcraft shot recipe "Biểu đồ sống động" (Remotion composition, Apache-2.0) published on gimgs.net.
Recipe JSON (prompt = timing/easing/parameter table/pitfalls, files = TSX source): https://gimgs.net/motion/chart-live-moves.json
Raw TSX: https://gimgs.net/motion/chart-live-moves/template.html
Repository: https://github.com/Vincentwei1021/video-shotcraft  (component: demos/data/chart-live-moves/AxisRescaleShockV2.tsx, demos/data/chart-live-moves/OscilloscopeStreamV2.tsx, demos/data/chart-live-moves/UnitDotSwarmRegroupV2.tsx; imports demos/_fixtures and assets/lib)
Spec: 1920x1080, 30 fps, 5.38s

1. Read the JSON and follow its "prompt" section (when to use, intention, parameter table, known pitfalls).
2. Adapt it for: <describe what you want>.
3. Either clone the repo, register the component as a <Composition> in a Remotion project and run npx remotion render <CompositionId> out.mp4 — or re-implement the recipe in your own engine (HTML/WAAPI works: keep the same timing and easing).
// ===== demos/data/chart-live-moves/AxisRescaleShockV2.tsx =====
// axis-rescale-shock-v2 —— 轴爆表重标 v2(批次 6 "改改再看" 重做)
// 相对 v1 的加码:爆表点冲出卡片顶 80→220px(真的冲进标题字区域)、冲出段折线
// 加粗 10px 且变琥珀;重标瞬间"哗"——旧刻度数字向下飞出淡出、新刻度从上滑入,
// 网格 4→8 根同帧加密;真图表语境:真标题 "Monthly revenue"、真轴刻度
// $25k/$50k/$75k/$100k → $100k/$200k/$300k/$400k、真月份 x 轴、端点弹真值
// 标签 "$340k";卡片震动 3→8px。收尾 f120 后真静止 40f。
// 帧确定性:数据硬编码,全部 frame 派生,无 Math.random / Date.now。
import React from 'react';
import { useCurrentFrame, interpolate, Easing } from 'remotion';
import { G, TitleBlock } from '../../_fixtures/Fixtures';

const AMBER = '#b45309';

const CARD_W = 1060;
const CARD_H = 600;
const CX = (1920 - CARD_W) / 2;
const CY = (1080 - CARD_H) / 2 + 40;
const PAD = 52;
const AXIS_W = 96; // 左侧 $ 刻度位
const PLOT_W = CARD_W - PAD * 2 - AXIS_W;
const PLOT_H = 360;
const PLOT_X = PAD + AXIS_W;
const PLOT_Y = 130;

// 历史数据($k,0–100 量程内温和爬升),最后一点爆表 340
const DATA = [22, 30, 26, 38, 35, 47, 44, 58, 55, 66, 72, 340];
const N = DATA.length;
const MONTHS = ['Jan', 'Feb', 'Mar', 'Apr', 'May', 'Jun', 'Jul', 'Aug', 'Sep', 'Oct', 'Nov', 'Dec'];

const HOLD = 12;
const DRAW_END = HOLD + 34; // f46:历史段画完
const SHOCK_END = DRAW_END + 16; // f62:爆表点冲顶
const BEAT = SHOCK_END + 16; // f78:停半拍(悬在标题区)
const RESCALE_END = BEAT + 12; // f90:重标完成
const MARK_END = RESCALE_END + 8; // f98:端点标记弹出
const VAL_END = MARK_END + 10; // f108:真值标签弹出

const easeDraw = Easing.inOut(Easing.cubic);

export const AxisRescaleShockV2: React.FC = () => {
  const frame = useCurrentFrame();

  // 量程:0–100 → 0–400,重标 12f out-cubic
  const range = interpolate(frame, [BEAT, RESCALE_END], [100, 400], {
    easing: Easing.out(Easing.cubic),
    extrapolateLeft: 'clamp',
    extrapolateRight: 'clamp',
  });
  const yOf = (v: number): number => PLOT_H - (v / range) * PLOT_H;

  const drawT = interpolate(frame, [HOLD, DRAW_END], [0, N - 2], {
    easing: easeDraw,
    extrapolateLeft: 'clamp',
    extrapolateRight: 'clamp',
  });
  const shockT = interpolate(frame, [DRAW_END + 2, SHOCK_END], [0, 1], {
    easing: Easing.in(Easing.cubic),
    extrapolateLeft: 'clamp',
    extrapolateRight: 'clamp',
  });

  // 冲顶停位:卡片上沿之上 220px(PLOT_Y=130 → 相对绘图区顶 -350),真冲进标题字区
  const SHOCK_Y = -(PLOT_Y + 220);
  const rescaleP = interpolate(frame, [BEAT, RESCALE_END], [0, 1], {
    easing: Easing.out(Easing.cubic),
    extrapolateLeft: 'clamp',
    extrapolateRight: 'clamp',
  });

  const xOf = (i: number): number => (i / (N - 1)) * PLOT_W;

  // 历史段点集
  const basePts: string[] = [];
  const upto = Math.min(drawT, N - 2);
  for (let i = 0; i <= Math.floor(upto); i++) basePts.push(`${xOf(i).toFixed(2)},${yOf(DATA[i]).toFixed(2)}`);
  if (upto < N - 2 && upto > Math.floor(upto)) {
    const i = Math.floor(upto);
    const f = upto - i;
    const x = xOf(i) + (xOf(i + 1) - xOf(i)) * f;
    const y = yOf(DATA[i]) + (yOf(DATA[i + 1]) - yOf(DATA[i])) * f;
    basePts.push(`${x.toFixed(2)},${y.toFixed(2)}`);
  }

  // 爆表段单独一根(琥珀 + 10px 加粗),起点 = 历史最后一点
  let headX = basePts.length ? Number(basePts[basePts.length - 1].split(',')[0]) : 0;
  let headY = basePts.length ? Number(basePts[basePts.length - 1].split(',')[1]) : 0;
  let shockSeg: string[] = [];
  if (shockT > 0) {
    const x0 = xOf(N - 2);
    const y0 = yOf(DATA[N - 2]);
    const x = x0 + (xOf(N - 1) - x0) * shockT;
    const yEnd = SHOCK_Y + (yOf(DATA[N - 1]) - SHOCK_Y) * rescaleP;
    const y = y0 + (yEnd - y0) * shockT;
    shockSeg = [`${x0.toFixed(2)},${y0.toFixed(2)}`, `${x.toFixed(2)},${y.toFixed(2)}`];
    headX = x;
    headY = y;
  }

  // 重标"哗":旧刻度向下飞出淡出、新刻度从上滑入
  const swap = interpolate(frame, [BEAT, BEAT + 10], [0, 1], {
    easing: Easing.out(Easing.cubic),
    extrapolateLeft: 'clamp',
    extrapolateRight: 'clamp',
  });
  const OLD_TICKS = ['$25k', '$50k', '$75k', '$100k'];
  const NEW_TICKS = ['$100k', '$200k', '$300k', '$400k'];

  // 网格密度 4→8:新增的 4 根细网格随 swap 浮现
  const denseOp = swap;

  const markS = interpolate(frame, [RESCALE_END, MARK_END], [0, 1], {
    easing: Easing.out(Easing.back(2.2)),
    extrapolateLeft: 'clamp',
    extrapolateRight: 'clamp',
  });
  const valS = interpolate(frame, [MARK_END, VAL_END], [0, 1], {
    easing: Easing.out(Easing.back(1.8)),
    extrapolateLeft: 'clamp',
    extrapolateRight: 'clamp',
  });

  // 爆表瞬间卡片震(±8px,8f 内衰减归零)
  const kick =
    frame >= SHOCK_END && frame < SHOCK_END + 8
      ? 8 * (1 - (frame - SHOCK_END) / 8) * Math.sin((frame - SHOCK_END) * 2.6)
      : 0;

  const shockOn = frame >= DRAW_END; // 爆表段样式生效期

  return (
    <div style={{ width: 1920, height: 1080, background: G.bg, position: 'relative', overflow: 'hidden' }}>
      <div style={{ position: 'absolute', top: 100, width: '100%', textAlign: 'center' }}>
        <TitleBlock text="AXIS RESCALE SHOCK V2" size={72} />
      </div>

      <div
        style={{
          position: 'absolute',
          left: CX,
          top: CY,
          width: CARD_W,
          height: CARD_H,
          background: G.card,
          border: `2px solid ${G.border}`,
          borderRadius: 14,
          boxSizing: 'border-box',
          boxShadow: '0 2px 8px rgba(0,0,0,0.06)',
          transform: `translateY(${kick.toFixed(2)}px)`,
          overflow: 'visible', // 让爆表段真的越出卡片
        }}
      >
        {/* 真卡头 */}
        <div style={{ position: 'absolute', left: PAD, top: 34, fontFamily: 'Helvetica, Arial, sans-serif' }}>
          <div style={{ fontSize: 30, fontWeight: 700, color: G.ink }}>Monthly revenue</div>
          <div style={{ fontSize: 19, fontWeight: 500, color: G.mid, marginTop: 6 }}>FY2026 · all products · USD</div>
        </div>

        <div style={{ position: 'absolute', left: PLOT_X, top: PLOT_Y, width: PLOT_W, height: PLOT_H }}>
          {/* 基础网格 4 根 + 重标同帧加密出的 4 根 */}
          {[0, 1, 2, 3, 4].map((i) => (
            <div key={`g${i}`} style={{ position: 'absolute', left: 0, right: 0, top: (PLOT_H / 4) * i, height: 2, background: G.line }} />
          ))}
          {[1, 3, 5, 7].map((i) => (
            <div key={`gd${i}`} style={{ position: 'absolute', left: 0, right: 0, top: (PLOT_H / 8) * i, height: 1.5, background: G.line, opacity: 0.8 * denseOp }} />
          ))}

          {/* 刻度:同一格位,旧值下飞淡出 / 新值上方滑入 */}
          {OLD_TICKS.map((v, i) => {
            const y = (PLOT_H / 4) * (3 - i);
            return (
              <div key={`t${i}`} style={{ position: 'absolute', left: -AXIS_W, top: y - 13, width: AXIS_W - 14, height: 26, textAlign: 'right' }}>
                <div
                  style={{
                    position: 'absolute',
                    inset: 0,
                    fontFamily: 'Helvetica',
                    fontWeight: 700,
                    fontSize: 21,
                    color: G.mid,
                    textAlign: 'right',
                    opacity: 1 - swap,
                    transform: `translateY(${(swap * 30).toFixed(2)}px)`,
                  }}
                >
                  {v}
                </div>
                <div
                  style={{
                    position: 'absolute',
                    inset: 0,
                    fontFamily: 'Helvetica',
                    fontWeight: 700,
                    fontSize: 21,
                    color: G.ink,
                    textAlign: 'right',
                    opacity: swap,
                    transform: `translateY(${((swap - 1) * 30).toFixed(2)}px)`,
                  }}
                >
                  {NEW_TICKS[i]}
                </div>
              </div>
            );
          })}
          <div style={{ position: 'absolute', left: -AXIS_W, top: PLOT_H - 13, width: AXIS_W - 14, fontFamily: 'Helvetica', fontWeight: 700, fontSize: 21, color: G.mid, textAlign: 'right' }}>$0</div>

          {/* 图表上沿强调线 */}
          <div style={{ position: 'absolute', left: 0, right: 0, top: 0, height: 3, background: G.bar }} />

          <svg width={PLOT_W} height={PLOT_H} style={{ position: 'absolute', inset: 0, overflow: 'visible' }}>
            {/* 历史段 */}
            <polyline points={basePts.join(' ')} fill="none" stroke={G.ink} strokeWidth={5} strokeLinejoin="round" strokeLinecap="round" />
            {/* 爆表段:琥珀 + 10px,重标落回后收敛回常规 */}
            {shockSeg.length > 0 && (
              <polyline
                points={shockSeg.join(' ')}
                fill="none"
                stroke={AMBER}
                strokeWidth={shockOn && frame < RESCALE_END ? 10 : 6}
                strokeLinejoin="round"
                strokeLinecap="round"
              />
            )}
            {/* 端点标记 */}
            {markS > 0 && (
              <>
                <circle cx={headX} cy={headY} r={13 * markS} fill={AMBER} />
                <circle cx={headX} cy={headY} r={22 * markS} fill="none" stroke={AMBER} strokeWidth={3} opacity={0.55} />
              </>
            )}
          </svg>

          {/* 真值标签 "$340k"(端点旁弹出) */}
          {valS > 0 && (
            <div
              style={{
                position: 'absolute',
                left: headX - 178,
                top: headY - 27,
                width: 150,
                height: 54,
                background: AMBER,
                borderRadius: 10,
                color: '#fff',
                fontFamily: 'Helvetica, Arial, sans-serif',
                fontWeight: 800,
                fontSize: 30,
                display: 'flex',
                alignItems: 'center',
                justifyContent: 'center',
                transform: `scale(${valS.toFixed(4)})`,
                transformOrigin: 'right center',
              }}
            >
              $340k
            </div>
          )}

          {/* x 轴真月份 */}
          {MONTHS.map((m, i) => (
            <div
              key={`m${i}`}
              style={{
                position: 'absolute',
                left: xOf(i) - 30,
                top: PLOT_H + 16,
                width: 60,
                textAlign: 'center',
                fontFamily: 'Helvetica, Arial, sans-serif',
                fontSize: 18,
                fontWeight: 600,
                color: i === N - 1 ? AMBER : G.mid,
              }}
            >
              {m}
            </div>
          ))}
        </div>
      </div>
    </div>
  );
};


// ===== demos/data/chart-live-moves/OscilloscopeStreamV2.tsx =====
// oscilloscope-stream-v2 —— 示波流线 v2(批次 6 "改改再看" 重做)
// 相对 v1 的加码:流速 5.5→8px/f;写入点亮点 1.5×(7→10.5)、余辉 90→160px;
// 流动中途插入一次突发尖峰(振幅 2.2×、持续 ~20 帧写入后随流带走),尖峰经过写入点时
// 卡头实时读数跳大并变琥珀;真图表语境:真标题/真 y 轴刻度/真时间轴/实时读数。
// 刹停逻辑保留:f100–112 out-cubic 刹停,f112 后真静止 48f。
// 帧确定性:波形与尖峰包络都是纯 worldX 函数,无 Math.random / Date.now。
import React from 'react';
import { useCurrentFrame, interpolate, Easing } from 'remotion';
import { G, TitleBlock } from '../../_fixtures/Fixtures';

const AMBER = '#b45309';

const CARD_W = 1080;
const CARD_H = 560;
const CX = (1920 - CARD_W) / 2;
const CY = (1080 - CARD_H) / 2 + 40;
const PAD = 46;
const AXIS_W = 64; // 左侧 y 轴刻度位
const PLOT_X = PAD + AXIS_W;
const PLOT_W = CARD_W - PAD * 2 - AXIS_W; // 924
const PLOT_H = 300;
const PLOT_Y = 158;

const HOLD = 12;
const FREEZE_START = 100;
const FREEZE_END = 112;
const SPEED = 8; // px/frame(v1 5.5 → 8,~240px/s)
const AMP = 0.72; // 基础振幅占半高比例(给尖峰留出头部空间)

// 突发尖峰:worldX ∈ [288, 448](写入发生在 f48–68,之后随流向左带走)
const SPIKE_X0 = 288;
const SPIKE_W = 160;
const SPIKE_GAIN = 1.2; // 峰值 = 1 + 1.2 = 2.2×

const env = (x: number): number => {
  if (x <= SPIKE_X0 || x >= SPIKE_X0 + SPIKE_W) return 1;
  const p = (x - SPIKE_X0) / SPIKE_W;
  return 1 + SPIKE_GAIN * (0.5 - 0.5 * Math.cos(p * Math.PI * 2));
};

// 有效时间:HOLD 前为 0,之后线性流动,FREEZE 区间 easeOut 刹停为常数
const effTime = (frame: number): number => {
  const t = (f: number) => Math.max(f - HOLD, 0) * SPEED;
  if (frame <= FREEZE_START) return t(frame);
  const brakeDist = (t(FREEZE_END) - t(FREEZE_START)) * 0.45;
  return (
    t(FREEZE_START) +
    interpolate(frame, [FREEZE_START, FREEZE_END], [0, brakeDist], {
      easing: Easing.out(Easing.cubic),
      extrapolateRight: 'clamp',
    })
  );
};

// 波形:四个正弦叠加,x 单位 = 世界像素
const wave = (x: number): number =>
  0.34 * Math.sin(x * 0.021) +
  0.27 * Math.sin(x * 0.052 + 1.7) +
  0.18 * Math.sin(x * 0.013 + 4.2) +
  0.12 * Math.sin(x * 0.087 + 2.3);

const signal = (x: number): number => wave(x) * env(x) * AMP; // ∈ ~[-1.6, 1.6],常态 [-0.65, 0.65]
const yOf = (x: number): number => PLOT_H / 2 - signal(x) * (PLOT_H / 2);
// 读数映射:绘图区中线 = 1,000 req/s,上下沿 = 2,000 / 0
const valueOf = (x: number): number => Math.round(1000 + signal(x) * 1000);

const fmt = (n: number): string => n.toString().replace(/\B(?=(\d{3})+(?!\d))/g, ',');

const Y_TICKS = ['2.0k', '1.5k', '1.0k', '0.5k', '0'];
const X_TICKS = ['-60s', '-50s', '-40s', '-30s', '-20s', '-10s', 'now'];

export const OscilloscopeStreamV2: React.FC = () => {
  const frame = useCurrentFrame();
  const T = effTime(frame);

  const N = 270;
  const pts: string[] = [];
  for (let i = 0; i <= N; i++) {
    const px = (i / N) * PLOT_W;
    const worldX = T - (PLOT_W - px);
    pts.push(`${px.toFixed(2)},${yOf(worldX).toFixed(2)}`);
  }
  const headY = yOf(T);

  const frozen = frame >= FREEZE_END;
  const glowOp = interpolate(frame, [FREEZE_START, FREEZE_END], [1, 0], {
    extrapolateLeft: 'clamp',
    extrapolateRight: 'clamp',
  });

  // 余辉段:头部往回 160px(v1 90 → 160)
  const TAIL = 160;
  const tailPts: string[] = [];
  if (!frozen) {
    for (let i = 0; i <= 40; i++) {
      const px = PLOT_W - TAIL + (i / 40) * TAIL;
      const worldX = T - (PLOT_W - px);
      tailPts.push(`${px.toFixed(2)},${yOf(worldX).toFixed(2)}`);
    }
  }

  // 实时读数:尖峰经过写入点时跳大 + 变琥珀
  const spikeK = Math.min(Math.max((env(T) - 1) / SPIKE_GAIN, 0), 1);
  const hot = spikeK > 0.22;
  const readout = fmt(valueOf(T));
  const readScale = 1 + 0.32 * spikeK;
  const dotColor = spikeK > 0.15 ? AMBER : G.ink;

  return (
    <div style={{ width: 1920, height: 1080, background: G.bg, position: 'relative', overflow: 'hidden' }}>
      <div style={{ position: 'absolute', top: 110, width: '100%', textAlign: 'center' }}>
        <TitleBlock text="OSCILLOSCOPE STREAM V2" size={72} />
      </div>

      <div
        style={{
          position: 'absolute',
          left: CX,
          top: CY,
          width: CARD_W,
          height: CARD_H,
          background: G.card,
          border: `2px solid ${G.border}`,
          borderRadius: 14,
          boxSizing: 'border-box',
          boxShadow: '0 2px 8px rgba(0,0,0,0.06)',
        }}
      >
        {/* 真卡头:标题 + 副题 + 实时读数 */}
        <div style={{ position: 'absolute', left: PAD, top: 38, fontFamily: 'Helvetica, Arial, sans-serif' }}>
          <div style={{ fontSize: 30, fontWeight: 700, color: G.ink }}>Requests per second</div>
          <div style={{ fontSize: 20, fontWeight: 500, color: G.mid, marginTop: 8 }}>api-gateway · production · last 60 s</div>
        </div>
        <div
          style={{
            position: 'absolute',
            right: PAD,
            top: 36,
            textAlign: 'right',
            fontFamily: 'Helvetica, Arial, sans-serif',
            transform: `scale(${readScale.toFixed(4)})`,
            transformOrigin: 'right top',
          }}
        >
          <div style={{ fontSize: 46, fontWeight: 800, color: hot ? AMBER : G.ink, fontVariantNumeric: 'tabular-nums', letterSpacing: -1 }}>
            {readout}
          </div>
          <div style={{ fontSize: 18, fontWeight: 600, color: hot ? AMBER : G.mid, marginTop: 2 }}>req/s · live</div>
        </div>

        {/* y 轴真刻度 */}
        {Y_TICKS.map((t, i) => (
          <div
            key={`yt${i}`}
            style={{
              position: 'absolute',
              left: PAD - 6,
              top: PLOT_Y + (PLOT_H / 4) * i - 11,
              width: AXIS_W - 8,
              textAlign: 'right',
              fontFamily: 'Helvetica, Arial, sans-serif',
              fontSize: 20,
              fontWeight: 600,
              color: G.mid,
            }}
          >
            {t}
          </div>
        ))}

        <div style={{ position: 'absolute', left: PLOT_X, top: PLOT_Y, width: PLOT_W, height: PLOT_H }}>
          {/* 网格 */}
          {[0, 1, 2, 3, 4].map((i) => (
            <div key={`h${i}`} style={{ position: 'absolute', left: 0, right: 0, top: (PLOT_H / 4) * i, height: 2, background: G.line, opacity: 0.7 }} />
          ))}
          {[0, 1, 2, 3, 4, 5, 6].map((i) => (
            <div key={`v${i}`} style={{ position: 'absolute', top: 0, bottom: 0, left: (PLOT_W / 6) * i, width: 2, background: G.line, opacity: 0.45 }} />
          ))}

          <svg width={PLOT_W} height={PLOT_H} style={{ position: 'absolute', inset: 0, overflow: 'visible' }}>
            <polyline points={pts.join(' ')} fill="none" stroke={G.ink} strokeWidth={5} strokeLinejoin="round" strokeLinecap="round" />
            {!frozen && glowOp > 0 && (
              <polyline
                points={tailPts.join(' ')}
                fill="none"
                stroke="#6a6a68"
                strokeWidth={9}
                strokeLinecap="round"
                strokeLinejoin="round"
                opacity={0.55 * glowOp}
                style={{ filter: 'blur(2px)' }}
              />
            )}
            {/* 写入点亮点(1.5×) */}
            {!frozen && glowOp > 0 && (
              <>
                <circle cx={PLOT_W} cy={headY} r={24} fill={spikeK > 0.15 ? AMBER : '#8f8f8d'} opacity={0.35 * glowOp} style={{ filter: 'blur(5px)' }} />
                <circle cx={PLOT_W} cy={headY} r={10.5} fill={dotColor} opacity={glowOp} />
              </>
            )}
          </svg>
        </div>

        {/* x 轴真时间刻度 */}
        <div style={{ position: 'absolute', left: PLOT_X, top: PLOT_Y + PLOT_H + 14, width: PLOT_W }}>
          {X_TICKS.map((t, i) => (
            <div
              key={`xt${i}`}
              style={{
                position: 'absolute',
                left: (PLOT_W / 6) * i - 40,
                width: 80,
                textAlign: 'center',
                fontFamily: 'Helvetica, Arial, sans-serif',
                fontSize: 19,
                fontWeight: 600,
                color: G.mid,
              }}
            >
              {t}
            </div>
          ))}
        </div>
      </div>
    </div>
  );
};


// ===== demos/data/chart-live-moves/UnitDotSwarmRegroupV2.tsx =====
// unit-dot-swarm-regroup-v2 —— 单位点阵重组 v2(批次 6 "改改再看" 重做)
// 相对 v1 的加码:点数 200→320、点径 7→9;真实叙事语境:图例 "Each dot ≈ 40 customers",
// 聚簇时每簇上方浮真标签(Free · 7,210 / Pro · 4,102 / Enterprise · 1,535,Pro 琥珀主角色),
// 列队成柱时柱底浮真轴标 + 基线;终幕点阵聚成 "12,847"(1/2/,/8/4/7 位图字形),
// 下方浮 "Total customers"。阶段间 hold 更短(14/38/36f 间隔)、迁徙 spring 更冲
// (stiffness 110→150、DUR 26→20)。收尾 f126 后真静止 44f。
// 帧确定性:伪随机全用 sin 散列,无 Math.random / Date.now。
import React from 'react';
import { useCurrentFrame, spring, interpolate } from 'remotion';
import { G, TitleBlock } from '../../_fixtures/Fixtures';

const AMBER = '#b45309';
const FPS = 30;
const N = 320;
const DOT_R = 9;

const M1 = 12; // 聚簇
const M2 = 48; // 列队成柱
const M3 = 84; // 收拢成 12,847
const DUR = 20;
const STAG = 8;

// 帧确定伪随机
const rnd = (i: number, salt: number): number => {
  const x = Math.sin(i * 12.9898 + salt * 78.233) * 43758.5453;
  return x - Math.floor(x);
};

// —— 阶段 0:散布(星群) ——
const scatter = (i: number): [number, number] => [
  300 + rnd(i, 1) * 1320,
  330 + rnd(i, 2) * 620,
];

// —— 分组:Free 180 / Pro 102 / Enterprise 38(每点 ≈ 40 customers) ——
const groupOf = (i: number): number => (i < 180 ? 0 : i < 282 ? 1 : 2);
const idxInGroup = (i: number): number => (i < 180 ? i : i < 282 ? i - 180 : i - 282);
const GROUP_N = [180, 102, 38];
const GROUP_LABEL = ['Free · 7,210', 'Pro · 4,102', 'Enterprise · 1,535'];

// —— 阶段 1:三簇(圆盘散布,sqrt 半径均匀) ——
const CLUSTER_C: [number, number][] = [
  [520, 620],
  [980, 570],
  [1400, 640],
];
const CLUSTER_R = GROUP_N.map((n) => 58 + n * 0.46); // 141 / 105 / 75
const cluster = (i: number): [number, number] => {
  const g = groupOf(i);
  const r = Math.sqrt(rnd(i, 3)) * CLUSTER_R[g];
  const a = rnd(i, 4) * Math.PI * 2;
  return [CLUSTER_C[g][0] + r * Math.cos(a), CLUSTER_C[g][1] + r * Math.sin(a)];
};

// —— 阶段 2:三根柱(8 点宽网格自底向上码放,底边对齐) ——
const BAR_BASE = 840;
const BAR_X = [520, 980, 1400];
const SPACING = 20;
const bar = (i: number): [number, number] => {
  const g = groupOf(i);
  const j = idxInGroup(i);
  const col = j % 8;
  const row = Math.floor(j / 8);
  return [BAR_X[g] + (col - 3.5) * SPACING, BAR_BASE - row * SPACING];
};

// —— 阶段 3:数字 "12,847" 点阵(5×7 位图 × 2×2 上采样 + 逗号) ——
const ONE = ['00100', '01100', '00100', '00100', '00100', '00100', '01110'];
const TWO = ['01110', '10001', '00001', '00010', '00100', '01000', '11111'];
const EIGHT = ['01110', '10001', '10001', '01110', '10001', '10001', '01110'];
const FOUR = ['00110', '01010', '10010', '11111', '00010', '00010', '00010'];
const SEVEN = ['11111', '00001', '00010', '00100', '00100', '00100', '00100'];
const CELL = 40;
const SUB = 20;
const Y0 = 390;
const cellPts = (x: number, y: number): [number, number][] => [
  [x, y],
  [x + SUB, y],
  [x, y + SUB],
  [x + SUB, y + SUB],
];
const buildDigit = (bitmap: string[], x0: number): [number, number][] => {
  const out: [number, number][] = [];
  bitmap.forEach((rowStr, r) => {
    rowStr.split('').forEach((c, col) => {
      if (c === '1') out.push(...cellPts(x0 + col * CELL, Y0 + r * CELL));
    });
  });
  return out;
};
const DIGIT_PTS: [number, number][] = [
  ...buildDigit(ONE, 350),
  ...buildDigit(TWO, 590),
  // 逗号:基线处两格,微斜的小尾巴
  ...cellPts(845, Y0 + 5.4 * CELL),
  ...cellPts(836, Y0 + 6.3 * CELL),
  ...buildDigit(EIGHT, 920),
  ...buildDigit(FOUR, 1160),
  ...buildDigit(SEVEN, 1400),
];
const digit = (i: number): [number, number] => {
  const p = DIGIT_PTS[i % DIGIT_PTS.length];
  const jx = (rnd(i, 5) - 0.5) * 7;
  const jy = (rnd(i, 6) - 0.5) * 7;
  return [p[0] + jx, p[1] + jy];
};

const lerp = (a: [number, number], b: [number, number], t: number): [number, number] => [
  a[0] + (b[0] - a[0]) * t,
  a[1] + (b[1] - a[1]) * t,
];

const fade = (frame: number, inA: number, inB: number, outA?: number, outB?: number): number => {
  const fi = interpolate(frame, [inA, inB], [0, 1], { extrapolateLeft: 'clamp', extrapolateRight: 'clamp' });
  if (outA === undefined || outB === undefined) return fi;
  const fo = interpolate(frame, [outA, outB], [1, 0], { extrapolateLeft: 'clamp', extrapolateRight: 'clamp' });
  return Math.min(fi, fo);
};

const LABEL_FONT = 'Helvetica, Arial, sans-serif';

export const UnitDotSwarmRegroupV2: React.FC = () => {
  const frame = useCurrentFrame();

  const dots = Array.from({ length: N }, (_, i) => {
    const stag = rnd(i, 7) * STAG;
    const mig = (start: number) =>
      spring({
        frame: frame - start - stag,
        fps: FPS,
        config: { damping: 11.5, stiffness: 150, mass: 0.8 },
        durationInFrames: DUR,
        durationRestThreshold: 0.0001,
      });
    let p = scatter(i);
    p = lerp(p, cluster(i), mig(M1));
    p = lerp(p, bar(i), mig(M2));
    p = lerp(p, digit(i), mig(M3));
    return p;
  });

  // 各阶段标签透明度(迁徙完成后浮现,下一次迁徙启动即撤)
  const clusterLabelOp = fade(frame, 38, 46, M2, M2 + 8);
  const barLabelOp = fade(frame, 72, 80, M3, M3 + 8);
  const captionOp = fade(frame, 114, 126);

  return (
    <div style={{ width: 1920, height: 1080, background: G.bg, position: 'relative', overflow: 'hidden' }}>
      <div style={{ position: 'absolute', top: 110, width: '100%', textAlign: 'center' }}>
        <TitleBlock text="UNIT DOT SWARM REGROUP V2" size={72} />
      </div>

      {/* 图例:每点的含义(全程挂角) */}
      <div
        style={{
          position: 'absolute',
          left: 90,
          bottom: 70,
          display: 'flex',
          alignItems: 'center',
          gap: 12,
          fontFamily: LABEL_FONT,
          fontSize: 24,
          fontWeight: 600,
          color: G.mid,
        }}
      >
        <div style={{ width: 18, height: 18, borderRadius: 9, background: G.mid }} />
        Each dot ≈ 40 customers
      </div>

      <svg width={1920} height={1080} style={{ position: 'absolute', inset: 0 }}>
        {dots.map((p, i) => (
          <circle key={i} cx={p[0]} cy={p[1]} r={DOT_R} fill={groupOf(i) === 1 ? AMBER : groupOf(i) === 2 ? G.ink : G.mid} />
        ))}
      </svg>

      {/* 阶段 1:簇标签(真人数) */}
      {clusterLabelOp > 0 &&
        CLUSTER_C.map((c, g) => (
          <div
            key={`cl${g}`}
            style={{
              position: 'absolute',
              left: c[0] - 200,
              top: c[1] - CLUSTER_R[g] - 66,
              width: 400,
              textAlign: 'center',
              fontFamily: LABEL_FONT,
              fontSize: 30,
              fontWeight: 700,
              color: g === 1 ? AMBER : G.ink,
              opacity: clusterLabelOp,
            }}
          >
            {GROUP_LABEL[g]}
          </div>
        ))}

      {/* 阶段 2:柱底基线 + 真轴标 */}
      {barLabelOp > 0 && (
        <>
          <div style={{ position: 'absolute', left: 380, width: 1160, top: BAR_BASE + 16, height: 3, background: G.bar, opacity: barLabelOp }} />
          {BAR_X.map((x, g) => (
            <div
              key={`bl${g}`}
              style={{
                position: 'absolute',
                left: x - 150,
                top: BAR_BASE + 30,
                width: 300,
                textAlign: 'center',
                fontFamily: LABEL_FONT,
                fontSize: 28,
                fontWeight: 700,
                color: g === 1 ? AMBER : G.mid,
                opacity: barLabelOp,
              }}
            >
              {['Free', 'Pro', 'Enterprise'][g]}
            </div>
          ))}
        </>
      )}

      {/* 终幕:数字下方真文案 */}
      {captionOp > 0 && (
        <div
          style={{
            position: 'absolute',
            left: 0,
            width: 1920,
            top: Y0 + 7 * CELL + 60,
            textAlign: 'center',
            fontFamily: LABEL_FONT,
            fontSize: 34,
            fontWeight: 600,
            color: G.mid,
            opacity: captionOp,
            letterSpacing: 2,
          }}
        >
          Total customers
        </div>
      )}
    </div>
  );
};
- Read the recipePrompt = when to use, intention, parameter table with typical values and how each one feels, known pitfalls. Treat values as calibrated starting points.
- Get the codetool: git
git clone https://github.com/Vincentwei1021/video-shotcraft && cd video-shotcraft && npm install - Register + rendertool: remotion
npx remotion render <CompositionId> out.mp4 # component: demos/data/chart-live-moves/AxisRescaleShockV2.tsx, demos/data/chart-live-moves/OscilloscopeStreamV2.tsx, demos/data/chart-live-moves/UnitDotSwarmRegroupV2.tsx - Or re-implementPort the timing/easing from the recipe to HTML + WAAPI (gimgs motion contract) or any engine; keep the same segment windows and easing.
| param | type | default | description |
|---|---|---|---|
| — | |||
Cùng danh mục
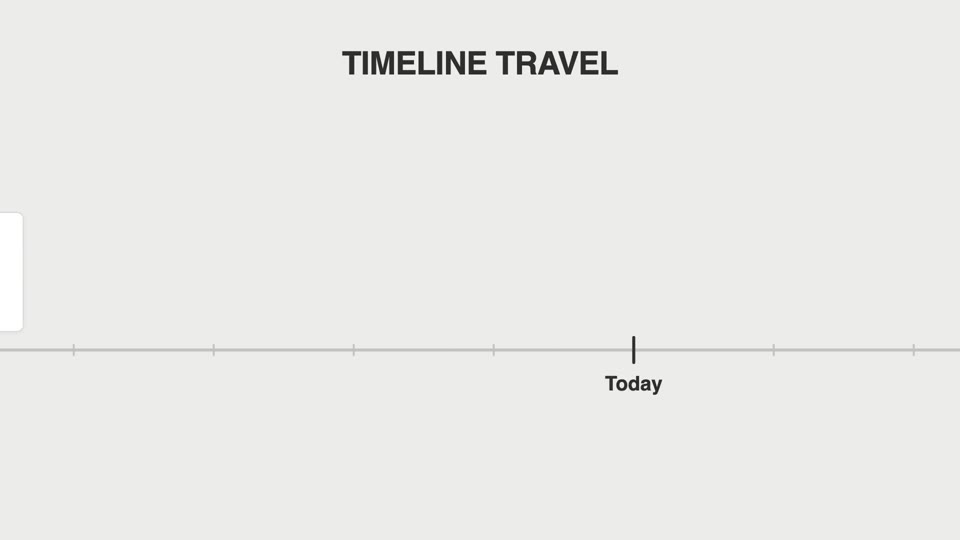
Lia dọc trục thời gian
Lia dọc trục thời gian — máy quay tăng tốc dọc theo trục thước ngang lướt qua các mốc phiên bản, mỗi mốc thẻ bật đứng dừng ngắn, mốc cuối phanh gấp đẩy máy vào.

Cuộn phanh gấp danh sách dài
Hai kiểu phanh cuộn dài: changelog-scroll-brake giảm tốc dừng chính xác; brake-reticle-lock thêm khóa tâm ngắm trên cùng khung hình.
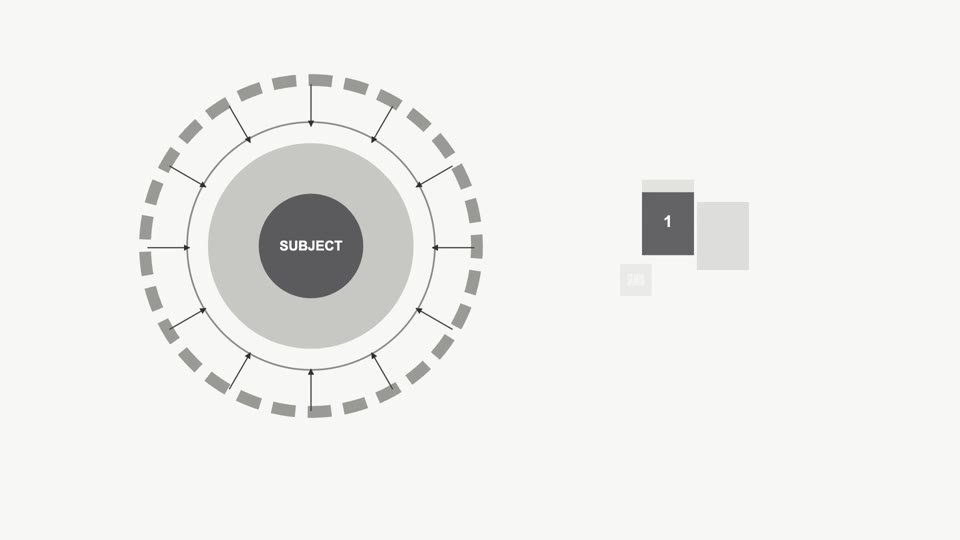
Vòng đồng tâm hé lộ chú thích
Chủ thể toàn màn hình bị khung tròn thu lại thành sơ đồ vòng đồng tâm, rồi cả nhóm dịch trái thu nhỏ để lộ chú thích.
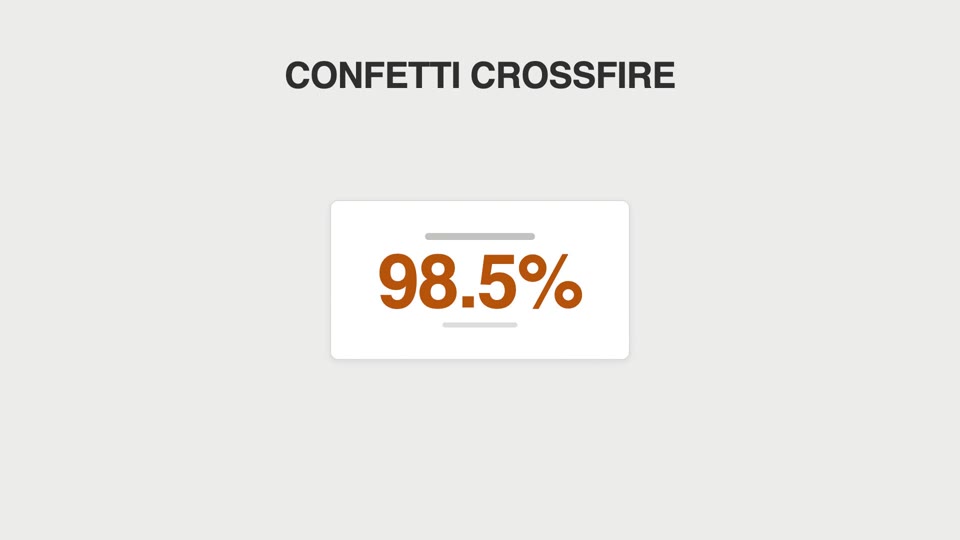
Va chạm ăn mừng bằng hạt
Hai kiểu hạt ăn mừng: confetti-crossfire bắn pháo hai bên, và counter-tick-sparks bắn tia lửa mỗi khi bộ đếm vượt mốc nghìn.